Lesson Modules
Teaching Tips:
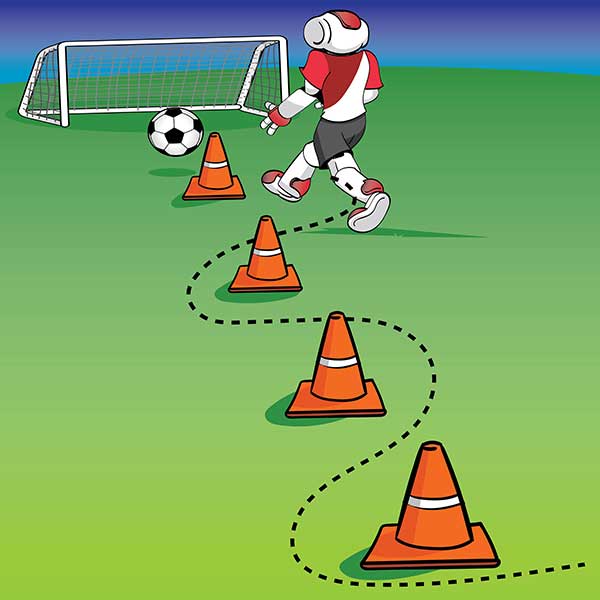
Show the student the video of zigzag practice and have students write the poll question. Share the poll results with the class and have a quick discussion about the common answers.
While picking up the words from the poll results, select the words that are related to this lesson.
To recall, the learning goal of this lesson is
- to compare and contrast sine and cosine curves
- to understand the amplitude
- to compare and contrast period and frequency
- to understand vertical/horizontal translations

Teaching Tips:
Students can do this activity individually or in a small group.
At the end of this module, have the students answer the questions and share the results.
You can use this time as a teaching moment or review time for the amplitude, frequency, and vertical/horizontal translations.
Ask students the following questions to lead a discussion.
- What is amplitude? How does the amplitude in the equation change the graph?
- What is frequency? How does the frequency of the equation change the graph?
Use the slide bars to adjust amplitude (a), frequency(b), and the vertical translation (c) to find the curve that Nao player can follow to avoid the obstacles and finish the curve as fast as she can.
If you don't see a curve on the soccer field, click on the field.
Write your anwer in a sentence for the following questions.
Teaching Tips:
Guide the students to write and verify their equations on the simulation first.
Have a few students run the physical robot or pick one or two groups to run the robot if the time is running out.
Use the slide bars to adjust amplitude (a), frequency(b), and the vertical translation (c) to find the curve that Nao player can follow to avoid the obstacles and finish the curve as fast as she can.
If you don't see a curve on the soccer field, click on the field.
Teaching Tips:
Give students a quiet individual time to answer the questions to reflect on what they've learned from this lesson. Share the self-reported scores with the class and have an open discussion of what went well and what could've done differently. You have access to the students' responses in your dashboard.
Note that this lesson is mentioning only the frequency. If the students are ready, then introduce the period vs. frequency.
Check your knowledge on each concept.
- Not at all
- Kind of got it
- Understand
- Pretty good
- Totally got it
- Not at all
- Kind of got it
- Understand
- Pretty good
- Totally got it
- Not at all
- Kind of got it
- Understand
- Pretty good
- Totally got it
- Not at all
- Kind of got it
- Understand
- Pretty good
- Totally got it
- Not at all
- Kind of got it
- Understand
- Pretty good
- Totally got it

