Lesson Modules
Teaching Tips:
Have students stand/sit in a circle and make sure you have an enough space for the autonomous car robot to move in a circular shape. Have two volunteers to write, and to measure the diameter of the circle.
Follow the directions below:
- Try larger angle measurement so Altino robot makes a small circle track.
- Have the writer to put the steering angle on the table.
- Let the autonomous car robot go and make a circle.
- Have the other student measure the diameter of the circle.
- The write adds the information to the table.
- Repeat step 1 through step 5 until you have 6 or 7 data in the table.

Question 1: What information do you need for the autonomous car to run a large size of the track?
Teaching Tips:
Have students explore how to find the expected value(s) by using the regression line. The following interactive tool can be also used to teach the regression line.To explore, follow the direction.
1. Here we have data collected from an experiment. Move the points to create a linear pattern.
2. Click on "Correlation". What happens to the correlation when you move a point?
3. Click on "Fit your line". Drag the line or the "x" to change the line. Try to find the "line of best fit".
4. Compare your line to the "Least Squares Line". What happens to the line of best fit when you move a point?
Teaching Tips:
Have students play with the simulation first, then pick a few students run the physical robot. We recommend to facilitate this activity as a game competition.The simulation includes circular car race track, diameter, and car on the start line.
Streer: ________[GO virtual robot]
Real robot:
Streer: ________[GO physical robot]
Teaching Tips:
Have students mark the self-reporting scores and write the in-depth question. You can see the scores from the class but the individual data is anonymous. You have access to the student's answers for the open-ended questions from the dashboard.
- I understand why data collection is needed and how to design to collect data.
- 1. not at all
- 2. kind of got it
- 3. understand
- 4. pretty good
- 5. totally got it
- Explain how you collected data for this lesson and why that was useful.
- Scatterplots
- 1. not at all
- 2. kind of got it
- 3. understand
- 4. pretty good
- 5. totally got it
- Explain what is scatterplots and when it is useful to use a scatterplot to display data.
- Correlations
- 1. not at all
- 2. kind of got it
- 3. understand
- 4. pretty good
- 5. totally got it
- What does that mean if the correlation is positive/negative?
- What can you tell between two data sets of which one has correlation 0.9 and the other has correlation 0.1?
- Residuals
- 1. not at all
- 2. kind of got it
- 3. understand
- 4. pretty good
- 5. totally got it

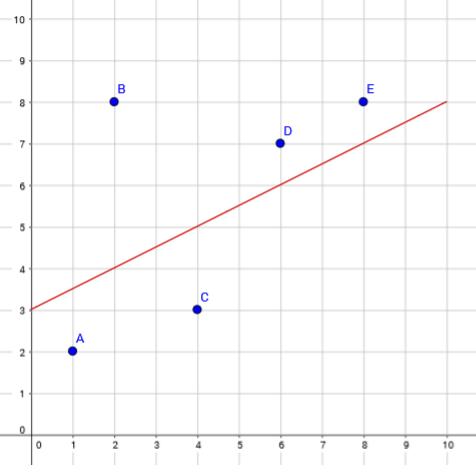
- What is the residual of the point C in the graph above?
- How do you use the residuals to find the best fit line?

