Lesson Modules
Teaching Tips:
Lesson Preparation:
- Charge AR.Drone and Tablet.
- Connect the tablet to a projector/ smart-board.
- Plug in AR.Drone battery.
- Place AR.Drone on the mat.
Lesson Tasks:
Once you open the lesson, you will be presented with a series of items that will need to be completed before you continue onward to the lesson.
The first step is to position the AR.Drone. The AR.Drone must be positioned on the mat above its grey silhouette, in a safe manner away from objects that could interfere with its flight path. It is important to use the mat, as the AR.Drone tracks the shapes on the mat and uses them to prevent drifting away from the take-off position. In this exercise the AR.Drone should travel up and down vertically, however, it is best to leave as much room as possible around the craft in all directions. Click the ''Ready'' button when positioned correctly.
Secondly, we need to make sure the AR.Drone has a fully charged battery connected to it. Flying the quadcopter requires a lot of energy, and it will eat up power at a fast rate. It is important the battery will last the entire lesson so make sure the battery pack is fully charged. Prepare ahead of time if possible - the battery pack takes approximately 90 minutes to fully charge.
Thirdly, there are some warnings listed. The quadcopter develops upwards thrust (which is called lift) by spinning its fan blades at a very high rate. It is important to avoid touching the quadcopter while in flight as the blades can cause injury. If at any point in time the copter deviates from your intended position, hit the red stop button (which you will be shown later). Read this section and when you are done, hit the ''Ready'' button.
The last section will attempt to connect to the AR.Drone. Wait until this section has turned green and then continue onwards to the lesson by clicking the ''START'' button. If you are having trouble connecting to the copter, go back and make sure it has its battery pack plugged in. When the pack is connected, the copter should turn on.
_____________________________________________________________________________________
- Engage students by asking them to come up with as many directly corresponding relationships as they can. The idea is to get them thinking about relationships that could be graphed as linear functions, but this does not need to be shared with students just yet.
Have students work in heterogeneous groups of two, three or four, whatever works best in your classroom environment. After a designated period of time (perhaps 2-3 minutes), have students post their ideas around the classroom.
Point out to students that for any of these examples, we could create a table with a very consistent and predictable pattern.
- Extend the example table to include 3 to 5 items, so that students can see the pattern and to provide coordinates for plotting.
Have students develop an expression to represent the table you created as well as for a few of the examples listed in the activity. Explain to students that the expression they have developed is in a form called slope-intercept form (y = mx + b). Let the students know that as they explore today, they will be identifying how changes in the slope (m) and the y-intercept (b) affect the graph.
Ask students to predict how these expressions might look on a graph (Expected response: a straight line or linear, but do not feel the need to correct unexpected responses, as this will become clear in the next portion of the activity)
- Assign each student an example shared on the posterboards or chart paper to graph them.
- Ask students what each of the graphs have in common. (They are all linear or represented by straight lines. They are all going higher on the graph as you move your finger to the right.) If a student has come up with an example that has a negative correlation, be sure to point that out to the students. Have students speculate why this line decreases or moves in the opposite direction of the others.
- As students share, look for examples that have dramatically different slopes (explain slope, if needed). Ask students, "Why is one graph steeper than the other?" (The greater the difference between the x and y value, the steeper the slope.)
Teaching Tips:
Using the simulator
Once you have continued through the selections successfully, you are presented with the main lesson window.
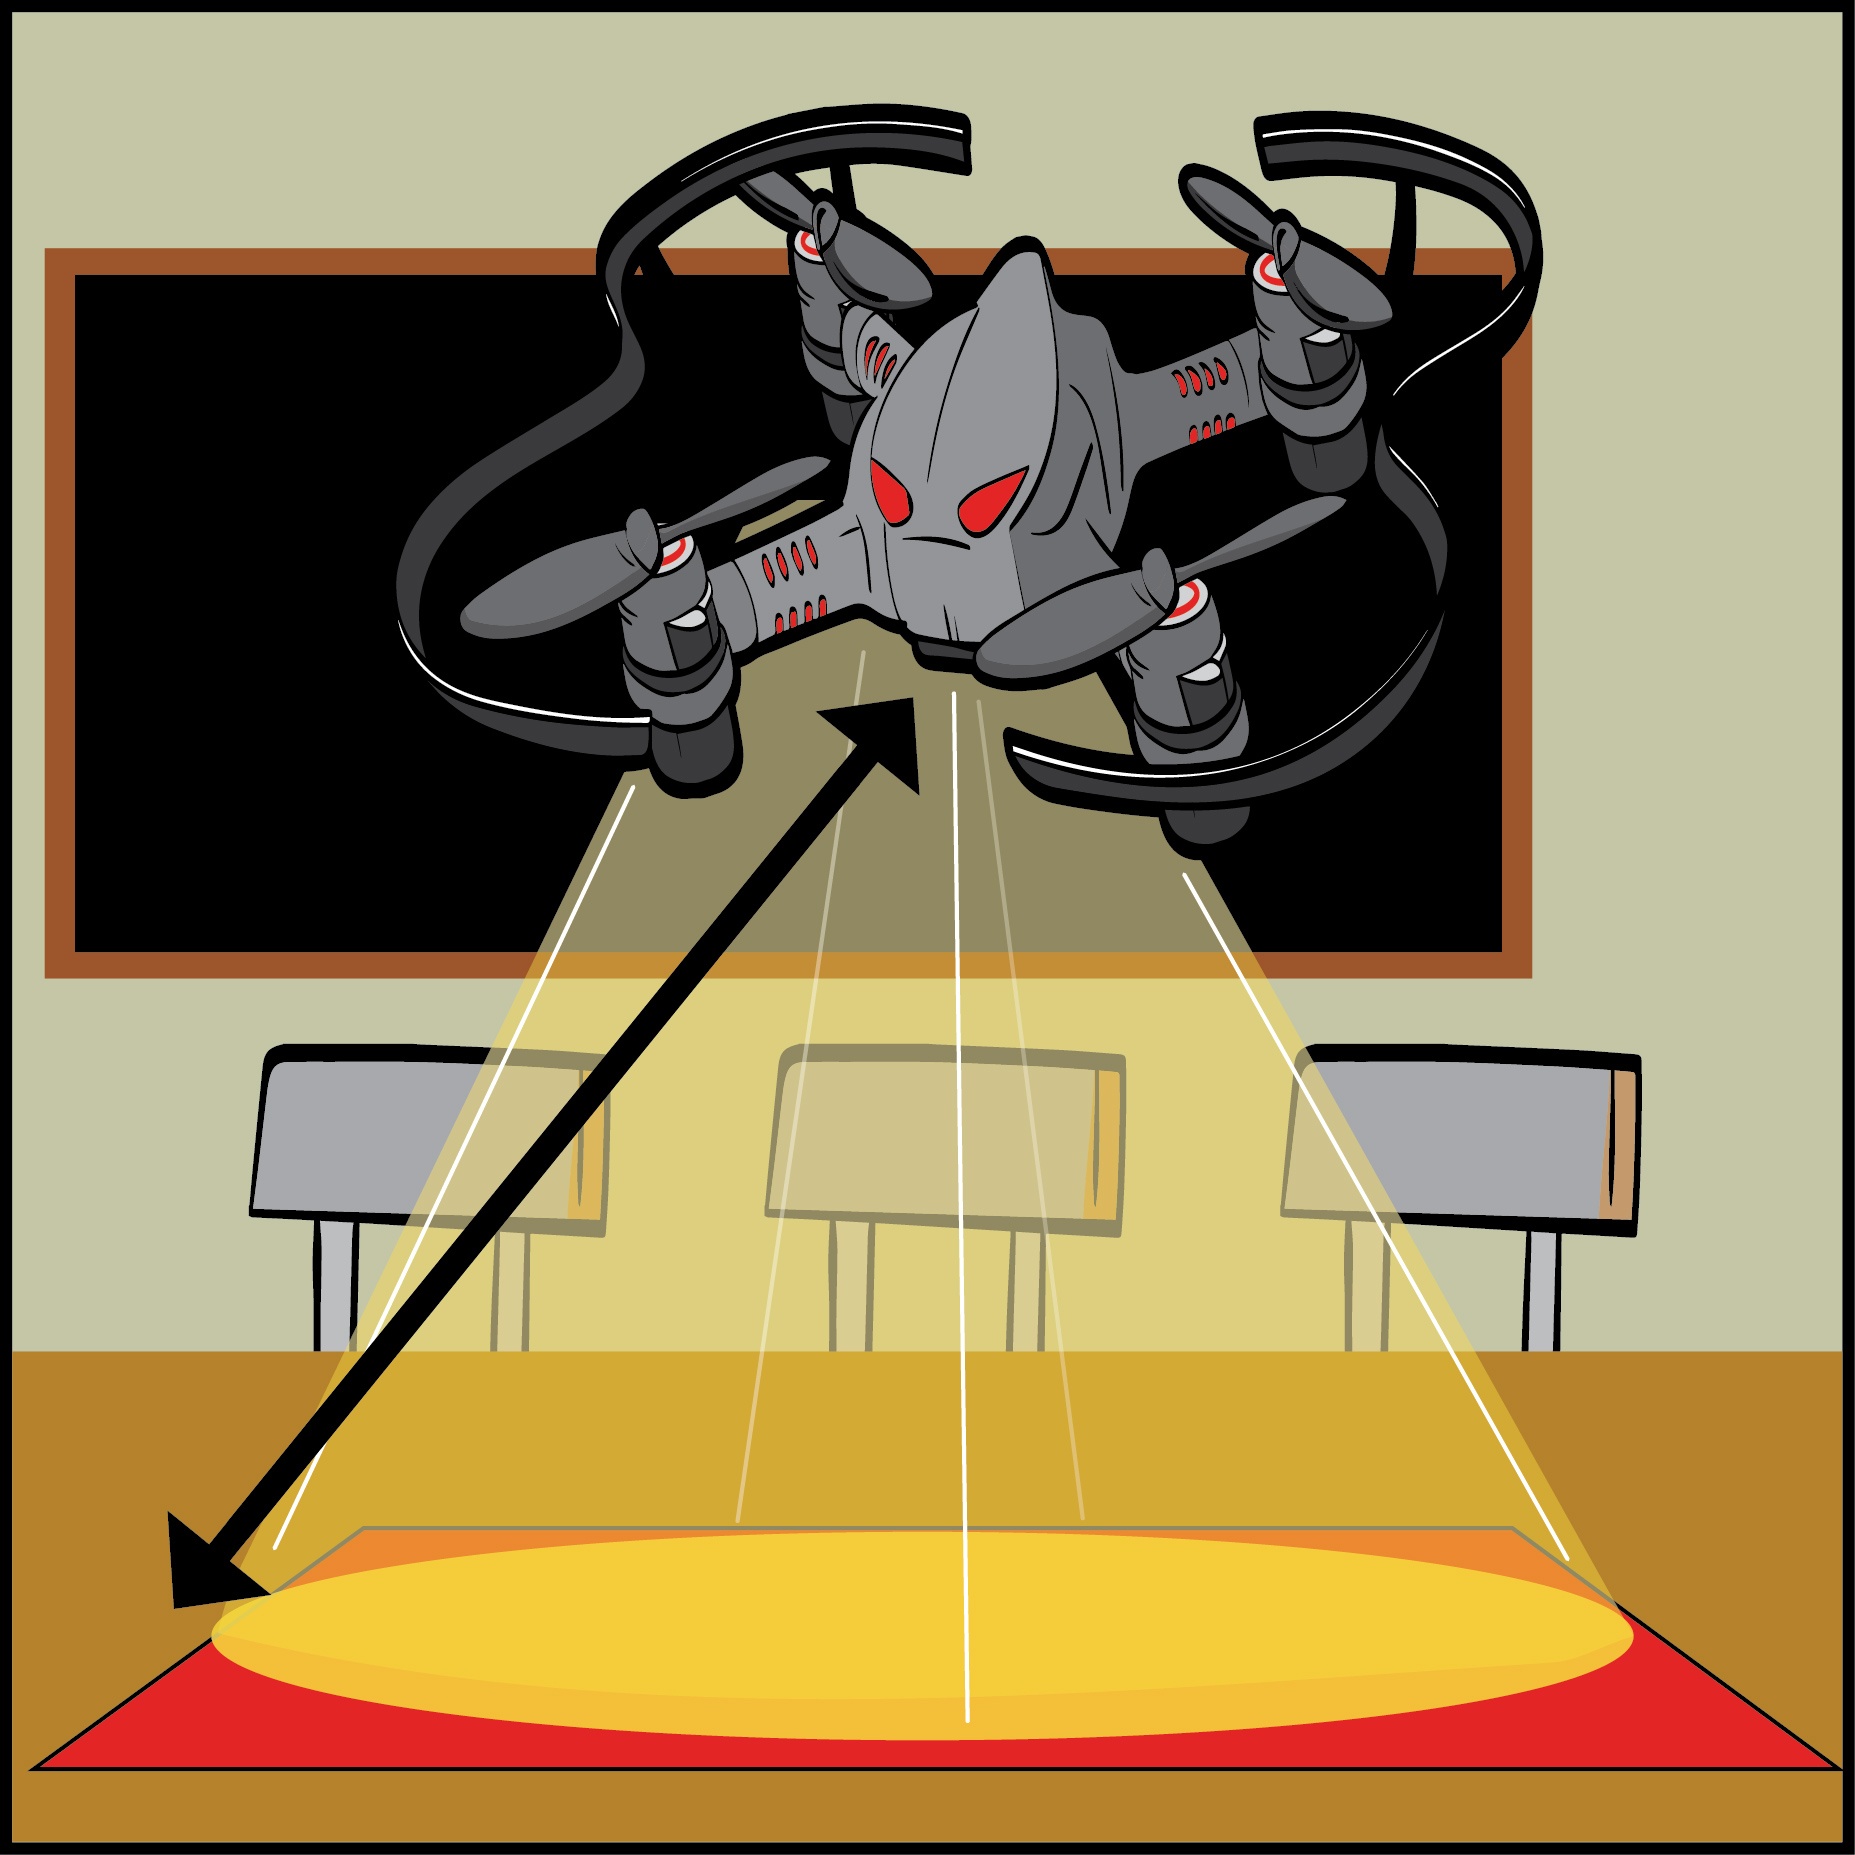
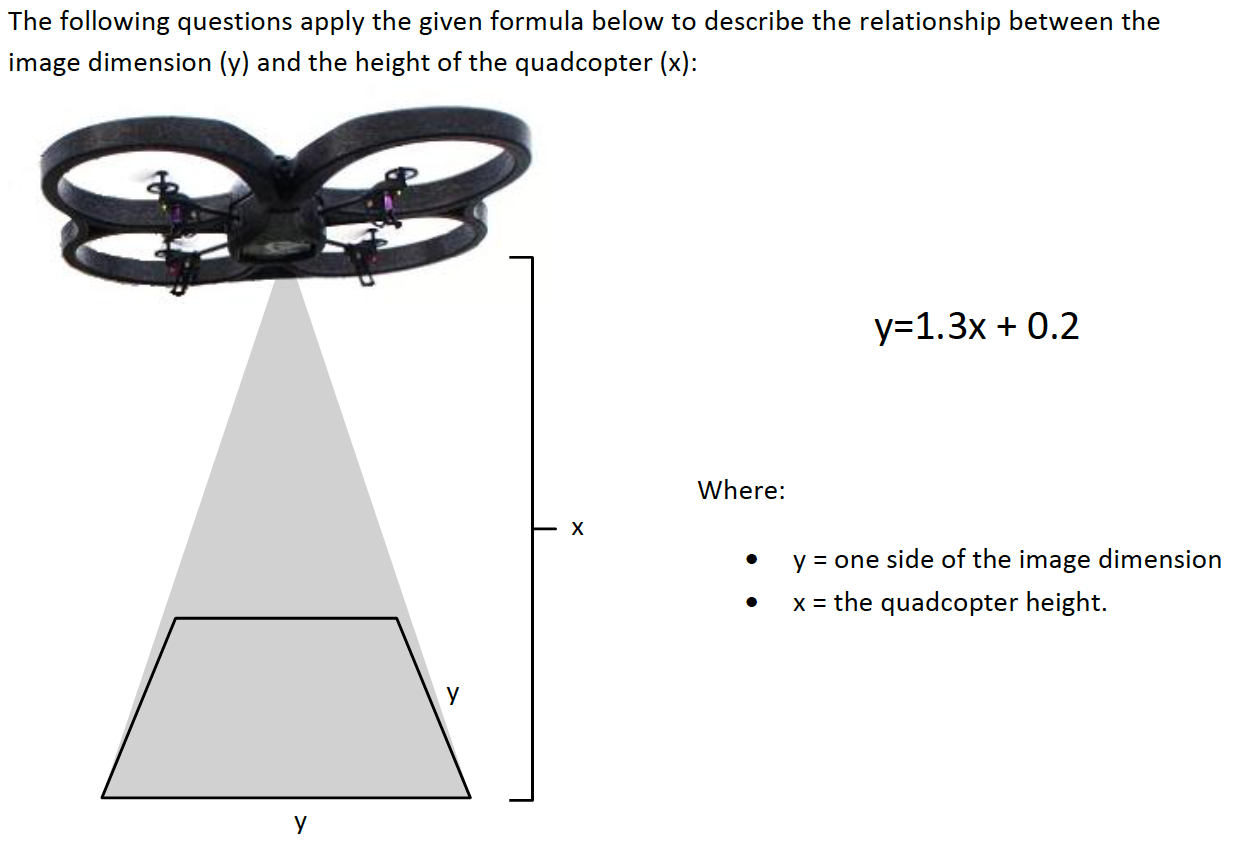
In this first screen, we have a column on the left along with an image of the AR.Drone in the center and accompanying data on the far right. The data on the right displays information about the copter's height, and camera characteristics. The formula for the edge length of the image is shown in bold. This formula relates the quadcopter's height to the size of what the camera can see.
Going back to the gray column on the left - at the top, we have a radio button that can be used to select the units we wish to teach the lesson in. At any point in time, you may switch between SI and English units.
Directly below are three tabs:
Prepare,
Demonstrate,
and Investigate.
The Prepare tab (which is the default mode that the lesson starts in), allows us to quickly familiarize ourselves with the lesson and to see how the quadcopter will operate. Simply push on the height bar (which is this vertical bar beneath the tabs) to choose a height you wish the copter to hover at. Once the directed height is obtained, the quadcopter will remain at the set height. Keep in mind that in this ''preparation'' mode, the quadcopter does not actually fly. This is just a virtual mode to illustrate how the lesson operates.
Additionally, there is an orange tab called ''GRAPH'' located to the immediate right of the gray column. You can drag or click this tab to display a graph of copter height vs. edge length. You can switch back and forth between the two displays. Note how the relationship is a linear path. The equation of this path is the formula displayed on the right in bold. A marker (shown in yellow and red) displays the location of the copter within the linear path.
Once you are satisfied with how the lesson operates, we are ready to move on with the incorporation of copter flight. To begin, click the ''demonstration'' tab. In demonstration mode, the screen appears almost identical to that of the ''prepare'' tab except that we now have the addition of a large green button in the lower right corner of the screen. This button starts and stops the copter flight. It will appear green to cause the copter to lift off, and remain red while in flight. While airborne, if at any point you feel that an unsafe condition might exist, or you want to land the copter for any reason, press this red button. This will land the copter.
The Demonstration mode works almost identical to the prepare mode. When you hit the green button and the quadcopter takes off, it elevates itself at 1 meter and then begins to hover. The takeoff procedure is automatic and takes a few seconds. Once the copter has reached the height of 1 meter, the height bar will be active and you can adjust the altitude of the copter. The maximum height of the AR.Drone is limited to 2 meters. Again, you can pull out the ''GRAPH'' tab to display the linear relationship between copter height and image edge length. When you are done demonstrating this relationship, press the red button and land the copter.
The next tab titled ''Investigate'' allows you to enter in specific height, edge, or area values and see the results. It is best to ask the students to solve for a specific value and then determine experimentally if the solution is correct. For example, you could ask that for a given height of 1.2 meters, what is the corresponding edge length that will be displayed on the camera.
When an answer is determined, plug it into the edge wheel, and press the green play button. The copter will hover at 1.2 meters and from here we should be able to see an image on the screen that is about 2.6 meters across. Corresponding data from the height, edge, and area can be seen in the far right again - so you can use that to check your work as well. Land the copter by pressing the red button, and run more scenarios. Given an edge length, what might the corresponding height of the quadcopter be? Figure it out and then run it!
When you are done with the lesson, press the blue back button in the upper right corner of the screen. This will return you to the lessons selection menu.
Now let's go through a quick lesson where we actually run the copter through the procedures I've just outlined.
First, take a freshly charged battery, and plug it into the AR.Drone. You will need to plug the black connector into the mating receptacle on the AR.Drone. In order to access the battery bay, you will need to remove the foam shell from the top of the copter.
Once this is done, simply connect the battery and secure it with the Velcro strap. When the battery is connected, the motors will go through a quick initialization procedure which will require the motors to slightly move.
Upon completion of this initialization, re-attach the foam shell and place the AR.Drone in an open area.
Once the copter is ready for flight, we are going to select the demonstrate tab on our lesson. To begin flight, press the green button.
At this point, the quadcopter will begin its takeoff routine and then hover at 1 meter.
To land the quadcopter, press the red button again, and the quadcopter will land.
To run the procedure again, we can repeat the last set of commands. Press the green button again and wait till the copter reaches 1 meter. Then we can adjust the height of the bar on the left to move the quadcopter up.
Then down
Then Up again
and finally commanding it to land with the red button.
____________________________________________________________________________________________________________________
- Show the students the simulator of the AR.Drone, as described before.
- Allow students to experiment by changing the slope value in their graphs.
- Discuss how changing the slope changes the visual representation. (Students need only be able to generalize this relationship, at this point; they do not need to learn to calculate the slope. However, if students discover this on their own, it should be encouraged.)
- Now, let's say I already had 3 units of the edge as constant. How could I represent this in a function? (2x + 3, with x representing the number of dozens). How would it change my graph? (It would move the graph up compared to where it would have been). Define the point at which the line crosses the y-axis as the y-intercept.
- Allow students to experiment by changing the value of the number representing the y-intercept on the simulator.
- Discuss how changing the y-intercept changes the visual representation.
How changing the slope changes the visual representation?
How could I represent a constant in a function?
How would it change my graph?
Define the point at which the line crosses the y-axis as the y-intercept.
Discuss how changing the y-intercept changes the visual representation.
Teaching Tips:
Students solve the following activities. They are allowed to use their simulators to help them understand the exercise.
Quiz Answers- Linear Search
- As the altitude of the copter goes up, the dimensions of the visible area from the camera increase. This relationship with edge length and height is proportional.
- It is related to height because the viewing angle of the camera is constant. The only way to increase the viewing area is to increase height.
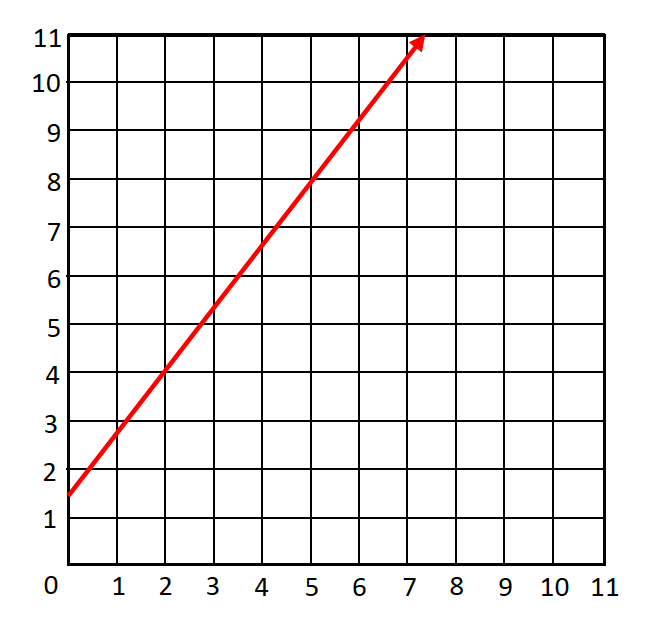
- The solution is the following graph:
- A
- D
- A
- B
- 15.8 meters
- 249.64 meters
- 249.64 meters2
- 9.07 meters
- None of the above
- 45.0 meters
- 48.2 meters
- 62.6 meters
- 34.5 meters
- None of the above
- 13.59 meters
- 7.769 meters
- 60.39 meters
- 184.69 meters
- None of the above
- 0.12 m per pixel
- .034 m per pixel
- 0.42 m per pixel
- 3.42 m per pixel
- None of the above
Teaching Tips:
Choose some students to share their answers and demonstrate their solution in front of the class. You can choose a different student in different exercises. Do not forget to ask questions to make sure their understanding of the problem. If the student did not answer the problem, encourage them to go in front and solve the problem with the help of their classmates.