Lesson Modules
Teaching Tips:
1. Show the simulation of the car on the icy road and demonstrate how to collect the data.
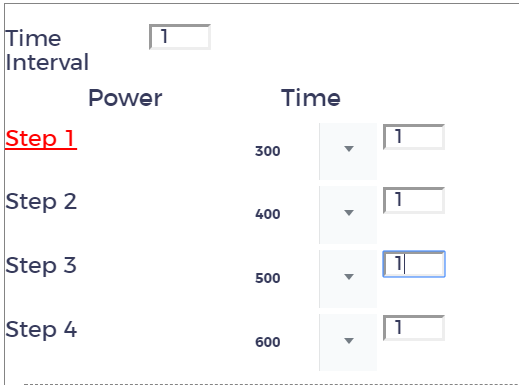
- Try first with the power of 300 and run the car for 1 second. Mark how many centimeters the car drove.
- Run the car with 400 power for 1 second for the next interval. Mark how many centimeters the car drove for that interval.
- Repeat with the energy power of 500 and 600. Mark the distance that the car drove for each interval.
- Refer to the image below to enter the correct input:
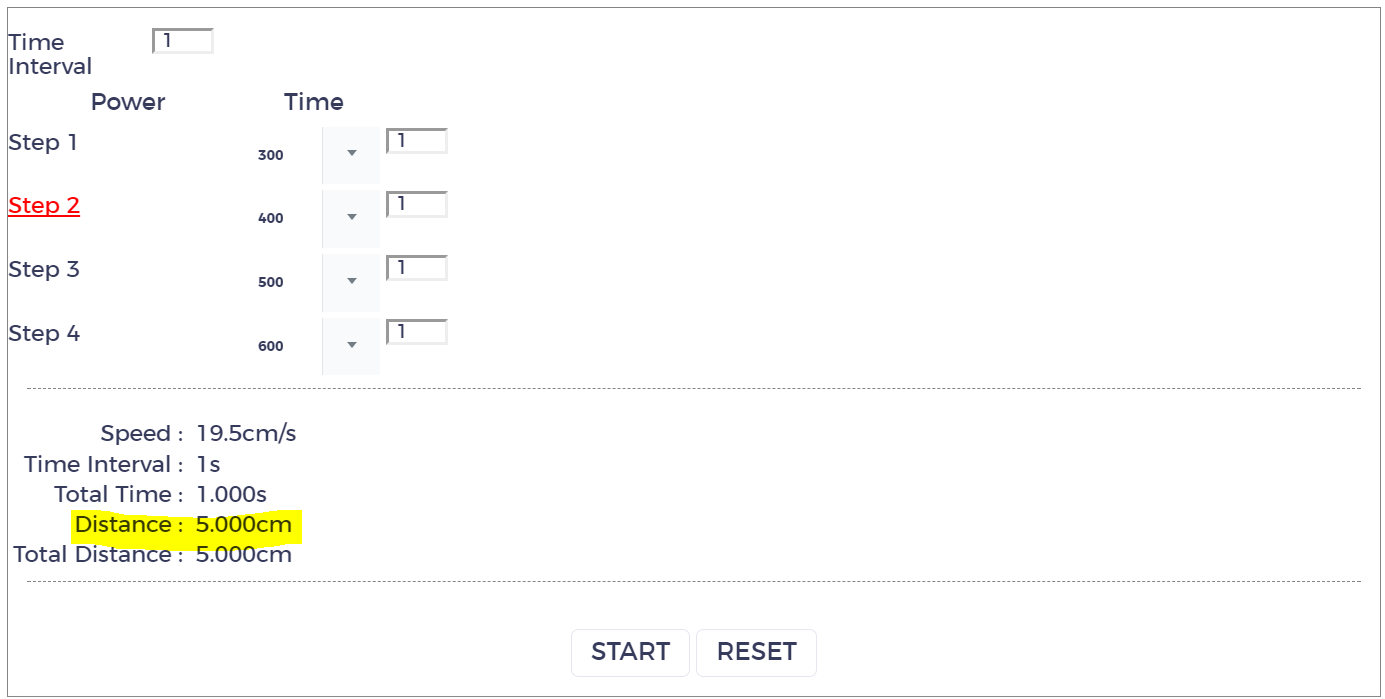
- Once you click on the START button, the simulation shows the Distance of each interval.
2. Complete the table in the Class View.
3. Plot the data in the graphing calculator. Ask the student if they see any patterns. If they can find the pattern, ask if they can predict how many centimeters the car would drive with 1000 energy power.
Watch this quick video to learn how to plot a point on the interactive tool.
You've probably heard of the fuel efficiency of cars described as MPG (Miles Per Gallon). Some hybrid cars can run more than 130 miles with one gallon of gasoline and some cars only can run 13 miles with one gallon of gasoline. When it comes to electric cars, we also need to think about how much the car can run with limited energy because the car cannot have unlimited battery power to carry with it.

Pop question: What MPG (miles per gallon) do you think this car has?
You will run the autonomous car with different energy power in the simulation below. Measure how far the car moved with the given power.
- Use a table to collect the data.
power distance the car drove for one second
Time Interval
Step 1
Step 2
Step 3
Step 4
Speed :
0.0cm/s
Time Interval :
0.0s
Total Time :
0.0s
Distance :
0.0cm
Total Distance :
0.0cm
Answer the following question.
Teaching Tips:
Explore
Have students explore how to find the expected value (energy power for wheels) by using the best fitting line. The following interactive tool can be used to teach the line of best fit concept.
Drive!!
Have students check their answer by running the car. The students might have to move to a hallway. The answer should be around 1000 (depending on the floor material).
Next, have students answer the questions about whether or not the car moves as they expected, and what they need to change to make it better.
Use this Scratch file for this activity.
Collecting Data
You will run the autonomous car with different energy power. You will measure how far the car moved with the given power.
- Find an open space with a flat surface to run the autonomous car.
- Connect
1. Bluetooth 2. Orchestra 3. Scratch 


Connect your autonomous car to your dedicated computer via Bluetooth.
Open Orchestra and connect your robot to the program.
If you don't have the program on your computer, use this link to download.
Open Scratch from Orchestra
- Open Scratch from Orchestra program
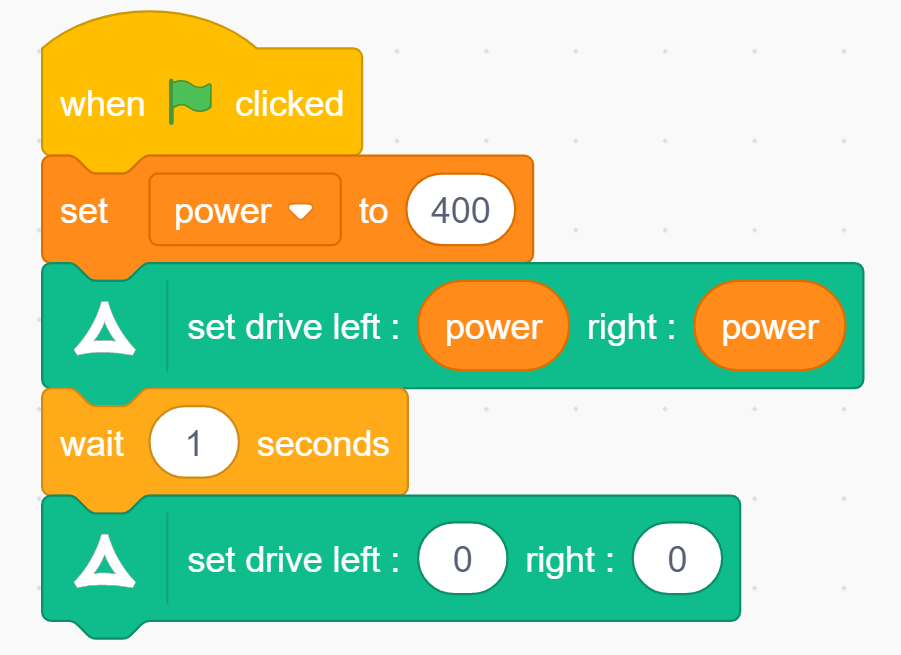
- Refer the blocks below to program the car
- Change the power to both the right and left wheels. Try different power between 300 and 600. You can run the experiment with the same energy power multiple times.
- Note that the car will move with at least 300 power to both left and right wheels. If the car is on the carpet, you should provide more power.
- Use a table to collect the data.
power distance the car drove for one second
Data Analysis
Now you collected the data but how do you comprehend the data? Can you find the patterns? What does each pattern do?
To explore, follow the direction.
- Define the x-axis for energy power for each wheel and y-axis for the distance the car drove for one second.
- Graph points of your collected data from the experiment by moving the blue points on the x-y plane. If you have extra points, place them along the line of the pattern.
- Click on "Fit your line". Drag the line or the "x" to change the line. Try to find the "line of best fit".
- Compare your line to the "Line of Best Fit". What happens to the line of best fit when you move a point?
Use the scatter plot and the best fit line to answer the following question. Write your answer using only the number.
Drive Autonomous Car!!
Now use the energy power to check if the car can drive 130 cm with the power.
- Not at all
- Not really
- Kind of
- Pretty much
- Totally
Teaching Tips:
Have students mark the self-reporting scores and write the in-depth question. You have access to the student's responses from the dashboard.
If time is allowed, have a quick discussion with the class to reflect on what went well and what could be done differently to have a better learning experience.
Have quite time to answer the following questions individually. Your answer will NOT be graded but only used for the next lesson. So be honest!
- Not at all
- Not really
- Kind of understood
- Pretty much understood
- Totally got it
- Not at all
- Not really
- Kind of understood
- Pretty much understood
- Totally got it
- Not at all
- Not really
- Kind of understood
- Pretty much understood
- Totally got it