
Lesson Modules
Teaching Tips:
Invite students to think about the image in the simulation below. Facilitate a discussion about their observations and questions with the following questions:
- If the cars will crash, what do you want to know?
--> Students might answer they want to know when they will crash or where they will crash.
- What do we know from the image? What information is given? (Students might not see the speedometers. So identify the speedometer and ask what we know from looking at it)
-->Students might answer distance and speed
- What is the distance unit? Is it centimeters, inches, meters? Do we have that information from the image?
- What is the speed unit? Is it centimeters per second or inches per minutes? Do we have that information from the image?
Show the question. Ask them "what do we need to know in order to calculate when the two cars will crash"?
Have students type their ideas and then share the results with the class.
Note: Tell the students to type only one word to represent what they wonder about the most.
In the simulation below, the cars are facing each other and may crash at some point.

Considering the image above - please answer the question. Type your answer using only ONE word.
Teaching Tips:
Preparation
Tell the students that we still don't have the units for the speed and the time but ask them to focus on the relationship between the speed, time and the distance.
To do so, have students work in a group and answer the three questions by using the interactive tool.
- Where do the cars collide?
- How long does it for the two cars to collide?
- How does the speed affect where and when they collide?
Your Challenge
Have students work in a group with the interactive tool to figure out what the relationship between the time and the speed is.
The speed for car 1 is set as 1 and the speed for the Car 2 is set as 2. Have the students create a graph using the x-axis for time and the y-axis for the distance from 0. Ask students to show the intersection point (or where they will collide).
Have the students work on a strategy of their choice. Distribute this table material.
If you are not familiar with the interactive tool, watch this quick video to learn how to plot a point and how to use the Freehand Shape.
While they are working on this activity, monitor and mark who is doing what.
Have students present their work (i.e., what they did, why they did it, and what they found out).
You can lead a discussion about their strategies and talk about the pros and cons of each one strategy. Make sure you present the table and lead the discussion using the following equation to solve the problem.
{latex{\begin{align}\text{total distance }&= \text{distance of car 1 + distance of car 2}\\&=\text{(speed of car 1)} \cdot t + \text{(speed of car 2)} \cdot t\\&=r_1 \cdot t + r_2 \cdot t\end{align}}latex}
A common mistake that some students make is confusing different units. The odometer tells how many centimeters per second. Help students identify the correct units so they can focus on the main concepts you want them to learn from this lesson.
If this is the first time to use the graphing tool, show the class how to plot a point on the class view.
The students can also use the Freehand Shape to draw a line that represents the pattern.

Ask students to write an equation for each line to answer the question.
Have students answer the questions and share their results with the class.
Preparation
Use the interactive tool below to change the time (t) and speed of each car. Answer the following questions with your group.
- Where do the cars collide?
- How long does it take for the two cars to collide?
- How does the speed affect where and when they will collide?
Your Challenge
Use this tool to complete the table. Fix the Car 1's speed to be 1 and Car 2's speed to be 2 (by default).
Click on the empty box next to Car 1 (Yellow) to keep track of the Car 1's movement and on the other box for Car 2 (Blue).
With your group, complete the table and the graph below.
1) Table
Fill out the table below with the data collected from the interactive tool above.
Distance (Car 1) and Distance (Car 2) mean the absolute distance that the car has driven for that time. For example, because the Car 2's speed is 2 cm/sec, Distance (Car 2) should be 2 cm at t=1.
The Total Distance explains how many centimeters both cars have driven.
Pop question: How far are the two cars apart at t=0? You will use this information on the table.
| time (sec) | Distance (Car 1) | Distance (Car 2) | Total Distance = D(Car 1) + D(Car 2) |
| 0 | |||
| 1 | |||
| 2 | |||
| 3 | |||
| 4 | |||
| 5 |
If the cars crash before 5 seconds, you should stop there. How do you know when to stop? Can the two cars exceed the total distance of 10 centimeters?
2) Graph
Define the x-axis as time in seconds and the y-axis as the distance between the car and the origin (0, 0). For example, the Car 2's position from the origin is 10 cm when t=0.
Plot the data collected from the interactive tool above. To plot a point, you can either 1) type the coordinate next to the plus sign or 2) click on the point icon then make your mark directly on the plane.
You can also use the Freehand Shape (under the arrow icon) to draw a line that represents the pattern.
Do the lines intersect? Where do they intersect? What does the intersection tell you?
Now answer the question below.
Teaching Tips:
In this module, students will experience a simulated environment, and if you have access to the real cars, they will be able to set the scene and run it in real-life.
If you don't have the program on your computer, use this link to download.
Lesson:
1. Set the scene with the real robots on a large table or on the floor. We don't recommend using multiple tables together since the edges can block the robot's motion.
2. Use a tape measure to estimate the distance. If you don't have a tape measure, use any material to make a line between two cars and use a ruler to calculate the distance.
3. Place the two cars a distance apart.
4. Give the students each car's speed. For example:
1) Scenario 1:
- Speed of Car 1 = 19.5 cm/s
- Speed of Car 2 = 35 cm/s
- Distance between the two cars = 150 cm
2) Scenario 2:
- Speed of Car 1 = 35 cm/s
- Speed of Car 2 = 3 cm/s
- Distance between the two cars = 200 cm
5. Have students solve the amount of time for each scenario.
6. Ask students what they want the car to do. Show them three statements and ask them to put the statement in order.
7. Have students find which block to use for each statement. You can demonstrate how to use the blocks from Scratch.
8. Show the power-speed conversion table and ask students to find power they should give the car to run at a specific speed.
9. Show them how to connect the autonomous car to their computers.
10. Have students program the autonomous cars, collect the data, and represent what's happening on a table or a graph.
Use this sample Scratch file for this activity.
Robot Simulation
Use the simulated environment below, and calculate the time in seconds that it will take the cars to get to each other based on the speed of car 1 and car 2. You can generate a new scenario by clicking the "Randomize" button.
Explore the 3D simulation by using the mouse buttons. The left click will let you rotate the view, the right-click to shift the view, and the scroll will zoom in/out.
 Rotate View
 Move Camera
 Zoom In
 Rotate View
 Move Camera
 Zoom In
Once you click on the Go button, look at the Remaining Time and Distance. If the Remaining Time has some positive values, that means the cars already crashed. If the Remaining Distance has some positive values, that means the cars stopped before they crashed and still have that much distance between them.
Program the autonomous car.
1. Set up the environment.
See the two cars on the table (or floor) and how far they are apart from each other.
2. Calculate the time.
Your teacher will give the cars' speed. Calculate when the cars will crash.
3. Put your thoughts in order. What do you want the car to do?
- keep doing what it does for a certain time
- stop
- drive at a certain speed
Put the statements in order and write your order in the box below. Make sure your answer doesn't include a space. For example, "abc" is fine but the system won't be able to recognize "a - b - c".
4. Which block should you use for the statement?
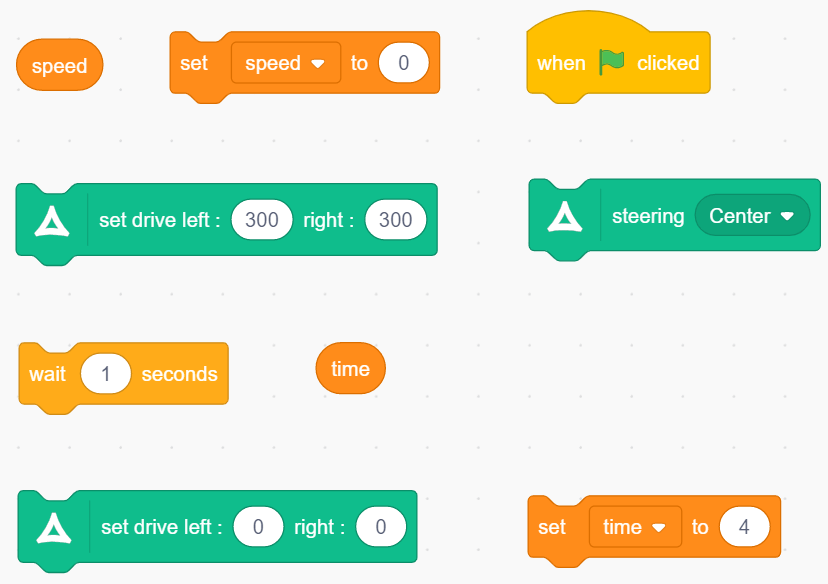
- keep doing what it does for a certain time
- stop
- drive at a certain speed
5. Think about the questions below and discuss with your team members before programming Scratch.
- What power do you need to give to the autonomous car? Use the table below.
| power | speed (cm/s) |
| 300 | 5 |
| 400 | 19.5 |
| 500 | 35 |
| 600 | 46.5 |
| 700 | 59.5 |
| 800 | 80 |
| 900 | 95.5 |
| 1000 | 133 |
- How long do you want the car to keep driving at the speed?
- What power do you need to give to the car so it stops?
6. Connect
| 1. Bluetooth | 2. Orchestra | 3. Scratch |
 |  |  |
Connect your autonomous car to your dedicated computer via Bluetooth. | Open Orchestra and connect your robot to the program. If you don't have the program on your computer, use this link to download. | Open Scratch from Orchestra |
7. Enjoy programming!
8. Collect the data from your autonomous cars and represent what's happening by using a table and a graph.
Teaching Tips:
Have students check their understanding of each concept and write the reflective response.
For this lesson, you've applied linear equations to solve a multi-step problem involving the distance-time-rate formula. The following are the concepts/skills that you've learned.
Mark your understanding of each concept/skill.
- Not at all
- Kind of got it
- Understand
- Pretty good
- Totally got it
- Not at all
- Kind of got it
- Understand
- Pretty good
- Totally got it